Critical Point
Definition
A point in the domain of a function is called a critical point of if
- for all unit vectors or
- a directional derivative does not exist at that point
Definition
A point in the domain of a function of variables is called a critical point of if
- for or
- one of the partial derivatives fails to exist at .
Fermat’s Theorem
Theorem
Suppose has a local minimum or local maximum at the point . Then is a critical point of .
Note
A critical point at which the function does not take an extreme value is called a saddle point.
Second Derivatives Test: Two Variables
Theorem
Let be a differentiable function and let be a critical point of the function. Denote
Then
- if and there is a local maximum at
- if and there is a local minimum at
- if there is a saddle point at .
- otherwise the test is inconclusive, i.e. when .
Hessian Matrix
Definition
Let be a function of variables. Then the Hessian matrix of at the point is given by
Second Derivatives Test
Theorem
Let be a differentiable function of variables and let be a critical point of the function. Let denote that eigenvalues of the Hessian matrix of at .
Then
- If for all then has a local maximum at
- If for all then has a local minimum at
- If for any then the test is inconclusive.
- Otherwise has a saddle point at .
Finding and classifying critical points in contour plots
In order to find critical points exactly, the main strategy is to start with a formula for your function and then solve the system of equations obtained by setting the first partial derivatives equal to . Sometimes it may be useful to present or detect critical points more globally, however. This will be particularly straightforward if we are in the two variable case and have acccess to a contour plot. It turns out that local minima, local maxima and saddly points are quite easy to detect in a contour plot. A caveat is that we need sufficient resolution in our contour plot. In other words, the levels for our level curves need to be sufficiently close together. Of course what is close enough depends on the function that we are considering.
Local minima/maxima
Here you see a typical contour plot for a local minimum or maximum:
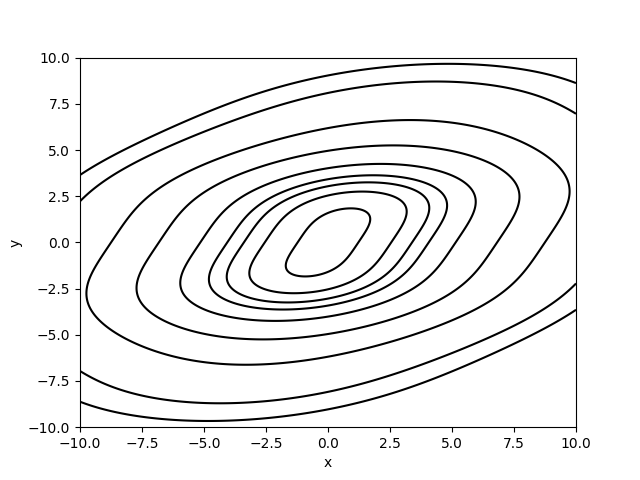
Indeed, for a local minimum or maximum we see that contour lines take the form of simple closed curves (like circles or ellipses) around the critical point. This is because the function must be increasing (in the case of a minimum) or decreasing (in the case of a maximum) in all directions around the critical point. Since the steepness needs to increase/decrease from to some positive/negative value we also typically see that the level curves get closer together as we move away from the critical point.
In the picture above it is not clear whether we are looking at a local maximum or a local minimum. Indeed the shape of the level curves is similar going from the a function to the function changes a local minimum to a local maximum, but it does not do anything to changes the shape of the contour plot. The only way to tell the difference between a local minimum and a local maximum is by including information about the level of each level curve in the contour plot. For instance, this shows that the following contour plot shows a local minimum:
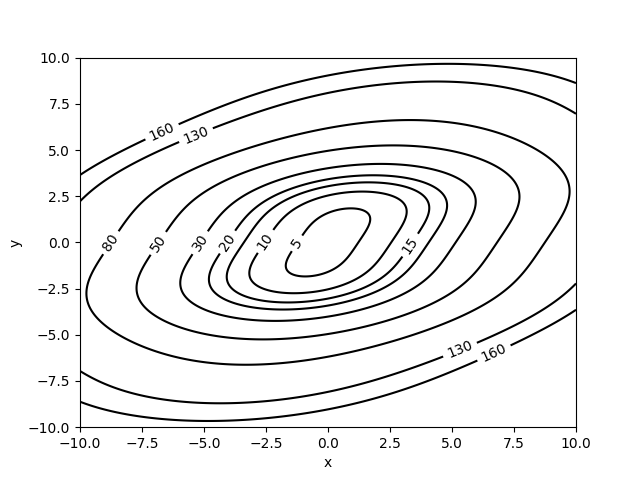
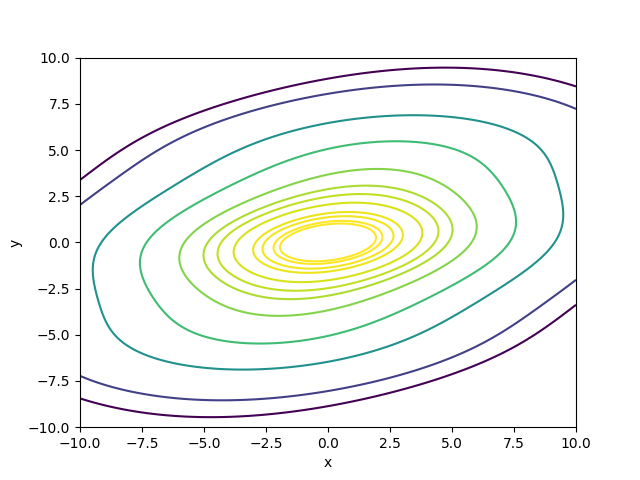
Of course, the level may also be indicated using color where usually shades of red indicate high levels and shades of blue indicate low levels. Convention may vary, however, and best practice is to include a legend. For instance, the following contour plot shows a local maximum
In this case, we have to be extra careful about the caveat on resolution mentioned above. If the resolution of the contour plot is too low then the information about the levels of the level curves may imply a certain critical point is a local maximum while it is actually a local minimum and vice versa.
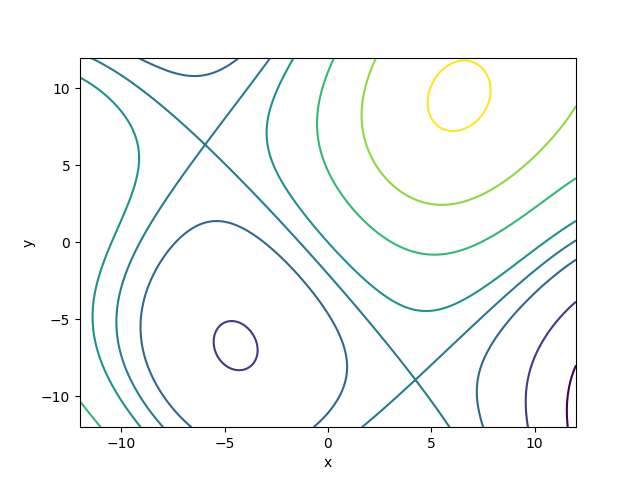
Saddle points
Here you see a typical contour plot for a saddle point:
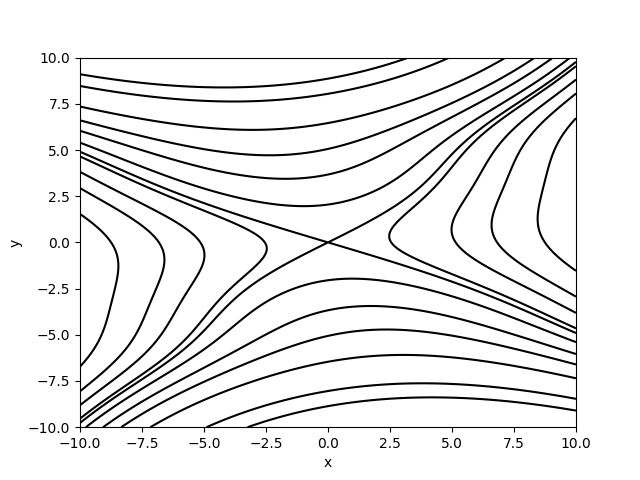
Indeed, for a saddle point we see that the critical point lies at the intersection of two level curves. Since the level curves intersect they must have the same level and might be viewed as just one level curve. This is because the function is increasing in one direction and decreasing in another. On the boundary between a region where it increases and a region where it decreases it must be neither increasing nor decreasing. So these boundaries form the intersecting lines.
Example
As a small example can you locate the four critical points in this contour plot (two saddle points, a local minimum and a local maximum)?